
Triple Premium, Triple Disaster
I sat staring in disbelief at my screen. It can’t be true. I had three premium players, three! 2 weeks back I thought I was the smartest chap around, me with my Salah, Lukaku and Ronaldo. Alas, I was just another FPL fool.
As my hopes slipped along with my FPL rank, I began to think where did it all go wrong. I did look at the stats, I thought about the opportunity costs, and Ronaldo is well, Ronaldo. Sure, some FPL YouTubers had warned against this but who were they to stand against the might of the premiums.
FPL is an emotional game. Exciting, but emotional. Data, on the other hand, strips you of emotions.
So I decided that’s where I’ll start and see why my TrIpLe PrEMiUM strategy failed.
Gathering the data
I extracted 6 seasons worth of data (2016/2017 to 2020/2021), focusing only on the top 100 scoring players within the respective seasons.
Metric wise, many OPTA stats were used, but the key ones to note are:
xG: Expected goals: This is calculated based on the number of shots taken, how and where the shots were taken from.
xA: Expected assists: This is calculated based on the number of key passes and attempted assists. The position of the pass and the nature of the play influence this metric.
xFPL per game: Combining the various key metrics such xG, xA, xClean sheets and more gives us the expected FPL points a player could score.
Why use expected instead of real data you say? It disregards players who severely underperformed as compared to any other player who would have scored. (Ahem, Adama)
It also disregards players who went through a purple patch but in truth, they were never meant to score that many points and probably would never do so again. (Looking at you Lingard).
Football is never 100% predictable, but so is life. Best you can do is stack the odds in your favour.
Insight: Not every dollar spent is equal

It should come as no surprise that the higher the price of the player, the higher the xFPL points per game. If you heard a soft “duh” in your head, don’t worry, you’re not alone.
What else then, can this graph tell us?
Firstly, it’s that a price increase is not proportionate to the increase in xFPL/game - not even close. Already, this doesn’t bode well for my triple premium strategy.
In a perfect world (or if I was Newcastle), I'd happily splash the cash and pick all the players priced 10 million and above in my team. Heck, I could probably delete my FPL app and only re-download it at the end of the season to collect my mini-league trophies.
Unfortunately, FPL is a game of constraints. The reality is that you only have a hundred million to spend.
With that in mind, it was time to dive deeper. I decided to segment the graph into price tiers:
Class A Premium Players (11-13 million):

Let’s do a little bit of back-calculating. Say our goal is to score 2400 points in a season - a modest score that could probably win you most mini-leagues.
We would have to score an average of 63 points per gameweek.
Every player would then have to score 5.72 points per gameweek on average.
With this in mind, let’s set a simple benchmark - an xFPL per game score of 5 would mean that a player is performing well.
In this bracket, 17 out of 26, or 65% scored more than an xFPL per game of 5.
This means that even if you’d randomly pick a player above 11mil, there’s a very high chance he’d score 5 points per gameweek for the whole season. If you captain the player, that’s 10 points guaranteed every gameweek.
Class B Premium Players (10-11 million):
Your Son, Vardys and Sterlings. How do they measure up against the Class A Premium Players?

We start to see the probability dropping off here.10 out of 18, or 55%, scored more than an xFPL per game of 5. A one out of two chance, still respectable.
Identity Crisis Players (8-10 million):
These are the players who can sometimes perform like a premium, but at other times make you want to pull out your hair. Sometimes, they can be hard to fit into your team so are they worthit?

Only 4 out of 37, or 10.8%, scored an xFPL per game of 5 or more.
Oof, that’s a painful drop.
This is when we can start to see something. Just like how you’d have certain expectations of a genuine Beats by Dr Dre vs the one you picked up from the night market that screams “your BlueTooth device is ready to pair” in your ears, you can definitely have harsh expectations on FPL players in different brackets.
Face it, Grealish can never perform as well as Salah.
Because of this fact, I lowered down the benchmark to an xFPL per game of 4. Using this, 24 out of 37, or 65% scored above the benchmark.
Mid Priced Mavericks (7-8 million):
Mason Mount, Bamford, Watkins, Zaha. These are your creative midfielders from the top teams or your talismanic strikers from mid-table teams. Personally, I’ve had many fond memories with these players in my team, but could these emotions be translated onto a cold-hearted graph?

In numbers:
xFPL per game of 5 and above: 8 out of 54, or 14.8 %
xFPL per game of 4 and above: 33 out of 54, or 61%
But here’s another important find:
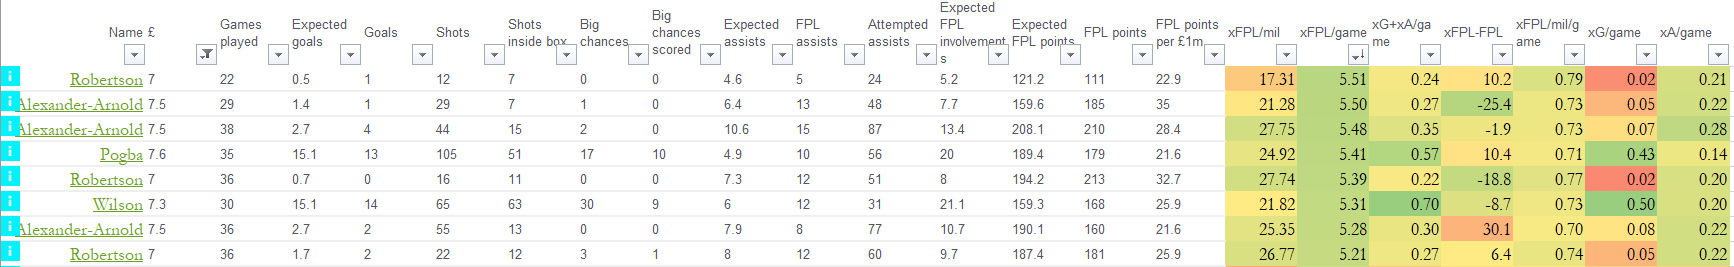
Too small? Can’t see?
Let me make it simple. Out of the 8 occurrences of players who scored more than an xFPL/game of 5, 3 were Trent Alexander-Arnold and 2 were Robertson.
Moral of the story? Just get Trent Alexander-Arnold. You won’t regret it.
Let's fast forward abit...
As much as I’d love coming up with names for every category, the trend starts becoming clear and more apparent as we go down in price.
This table summarizes the probability. We see horrifying drops the moment we enter the 6 to 7 mil category.
This means it gets harder and harder to make the right choice or select the right player.

Oh, and here’s one more thing that’s interesting for the top 30 scorers in the 5 to 6 million bracket:

Spot something? Here’s a little zoom in.

Yes. They’re all defenders from your top teams. If you’d ever have to choose, you might be better off getting a top team defender vs your cut-price midfielders or strikers.
The Moral Of The Story
It’s important to give a bit of perspective to the insights uncovered here. Sure, it’s simplified and there’s so much data in between the lines that can paint a clearer picture within the brackets, but the main takeaway is this:
If I want to find a way to maximise the odds of every player getting at least an xFPL/game of 4 and above, then these insights are indicative.
Let’s use my Triple Premium team as an example. And yes, I wildcarded for this shit.

2 things:
1) Only 6 out of 11 players had a decent probability (more than 50%) to score an xFPL/game of >4. They are marked in green.
2) Having Ronaldo prevented me from upgrading players like Semedo, White or even Sarr to players with a higher probability. In short, if Ronaldo failed, I was left severely exposed. Worst part? Only double-digit scores might have justified his inclusion, and what were the odds of that?
Let’s compare this to a team I randomly picked from the Overall top 10 (London Bees)

Here, London Bees had 8 players who had a more than 50% probability of scoring an xFPL/game of 5 or more. In short, he bought more tickets to the raffle. He went on to score a whopping average of 115 points per game since he wildcarded to this team in Gameweek 8. I won’t be surprised if his stellar performance were to continue.
My team? Scored an average of 56 points per gameweek. Big oof.
Final Thoughts: The Essence Of Scoring Points On FPL
FPL is a constrained optimization problem.
You want to score as many points as possible, but as with all things in life, you are faced with constraints. For FPL, you have 2 main constraints: A 100million budget, and a maximum of 11 players.
If I were to distil it into a single goal, to score points in FPL you would need to maximise the number of right decisions you make.
That means:
1. Efficient use of money. Every million you spend has to contribute to maximising your xFPL/game. Different priced players have different expectations and odds - not every dollar spent is equal!
2. Increasing your odds. The more high probability players you can include in your team, the better your chances.
3. As we’ve seen, an increase in player price does not translate to a proportionate increase in xFPL/game. Spread out your chances and don’t deny yourself the chance to get higher probability players.
4. Build your team structure to be flexible. Think of every position in your team as slots. For example, 2 Class A premium players, 1 Class B Premium Player, 2 Identity Crisis Players and 2-3 Mid Tier Players. Keep these slots as it allows you to switch between players in those brackets to cater to fixture swings or injuries. Oh, and don’t forget your top team defenders.
Whew. That seems all good on paper. Now, it’s time for me to lick my wounds and apply these insights as we cross into Gameweek 10. It’ll take a few gameweeks for me to restructure my team, but I’m in it for the long haul (or at least that’s what I tell myself).
I did a deeper dive into the determinants of xFPLs - mainly xG and xA, to explore the impact they have in generating points. But as of now, this article is already way too long for us digital natives with our limited attention spans, so I’ll save that for my next post.
In the meantime, godspeed for your gameweeks ahead.
Disclaimer: I’m in no way an expert in FPL, but I do love football and I do immensely enjoy trawling through data to uncover insights and narratives. However, I hope you find them useful for your own mini-leagues. If they aren’t, I hope you at least find some entertainment in my follies as I go through my FPL journey. Thank you!