

Following up on my previous analysis of potent attackers who lit up the season, it's time to turn our attention to team performances.
To illustrate my findings, I've developed radar charts that show key performance metrics and give us a measure of a team's playing style - a performance card of sorts.
Football can be a very emotional and biased affair - especially when it involves teams we support or hate. So can we trust what our eyes tell us?
Let the data decide!
Key Insights On Interesting Teams
Scroll down to A Brief Overview Of The Metrics Chosen if you want an explanation of the metrics chosen
Data from FBRef
Design inspired by Camille Walala
Liverpool, Manchester City & Chelsea


High octane, high pressing, attacking football. The top 3 teams have similar shapes to their radar charts, with stellar ranks for all categories.
Liverpool and Man City were so competitively close in all metrics that it's no surprise Man City eventually bested the Reds by only one point.
As a Liverpool fan, I'd like to believe that there was an element of luck ;)
Jokes aside, both clubs are the best at what they do and are worthy contenders to the throne indeed.
Tottenham

A rebel team in the top 4 that doesn't play the high press, opting for a counter-attacking style that utilizes the speedy and potent Son to great effect.
Spurs have low pressing grades but are amazing at soaking up pressure and preventing opponents from taking shots - a clear indication that Conte has got something right with his formation and defensive structure.
A high total progressive pass rank and total distance mean that they employ a fast, direct buildup the moment they win the ball, likely feeding longer balls to their speedy attackers.
Tottenham are incredibly efficient when they shoot, with the top xG/Shot rank in the whole league.
Manchester United
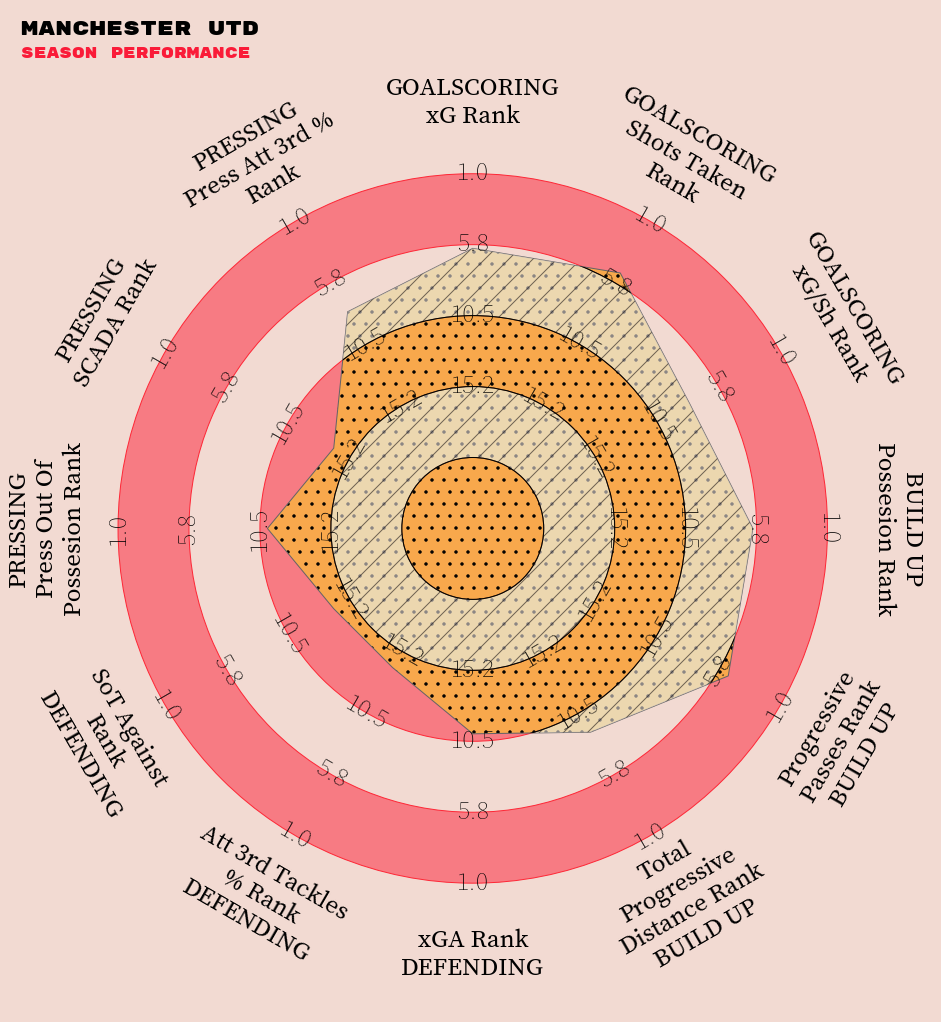
As previously analysed in "Why Does Every Man U Fan Need Ten Hugs?", Manchester United are above average at attacking but abysmal at defending.
There seems to be no coherent strategy - are they playing the high press or going for a compact formation and hitting on the counter?
While Man U ranks in the median percentile for Presses Out Of Possession and Attacking 3rd Presses, their SCADA rank and SoT Against Rank are close to what we would expect from the bottom half of the league. This means neither their pressing nor tactical defending are effective - opponents can easily find a path to goal.
Ten Haag would need to decide on his tactics fast, before deciding on what players he would want to bring in over the transfer window.
Brighton

Brighton has got defending all figured out, as well as good rankings for executing the high press and progressive build-up play.
Their only flaw is a lack of goalscoring threat, as can be seen from the clear dent under attacking metrics.
It's interesting to note that they do take a high volume of shots - only that the quality of shots is poor with a low xG/Sh rank.
Acquiring a proven striker might propel them to being a top 5 team.
Arsenal

Arsenal had an okay season, picking themselves up well after a torrid first few matches.
Eventually, they proved to be adept at defending and above average at attacking.
Arteta has employed a unique style - one that does not involve heavy pressing. But when Arsenal press, it happens a lot in the Attacking 3rd. This has led to a healthy score of SoT against.
The manager is doing something right, though if I were him, I would look to transfer in a ball-winning central mid and a proven goalscorer to challenge the top 4.
Leeds

Leeds also employ a high-octane, pressing game as evident from their stats.
But where did it go wrong?
It seems that they are not pressing high enough, and despite the volume, their presses lack quality as opponents can still perform a lot of shot-creating actions.
Whether it's due to player quality or the tactics behind their press - this is something Jesse Marsch needs to figure out before the new season starts, or Leeds might very well find themselves in another relegation battle.
See All Team Performance Charts & Playing Styles here
Stay tuned for a deeper analysis of select teams, with transfer suggestions that can alleviate their problems going into the new season.
A Brief Overview Of The Metrics Chosen
The radar chart consists of 4 key groups, with metrics chosen due to a high correlation to performance or a concise expression of a team's playing style.
A) Goalscoring Metrics:
These metrics measure the goalscoring potency of a team.
xG: The total expected goals for the season. Explanation of xG here. This will be the overall grade of attacking prowess.
Shots Taken: Total amount of shots taken throughout the season. This measures the volume of effort. Shots taken are highly correlated to xG (0.95)
xG/Sh: Amount of xG every shot generates. The scoring potential - aka quality - of each shot.
B) Buildup Metrics:
These metrics generally give us a strategic sense of how a team builds up and attacks. For example, do they play short passes, or are they a counter-attacking team with long, direct passes?
Possession: How much possession of the ball does the team have on average - do they like to keep it or soak up opponents' attacks?
Progressive Passes: Passes that move at least 10 yards (9.1m) towards the opponent's goal. This is a good indication of how well possession is used - do they pass sideways or forward?
Total Progressive Distance: Total distance of progressive passes - just how far do they travel to the opponent's goal? This gives a sense of whether teams adopt a short or long-passing game
C) Defence Metrics:
These capture key aspects that keep a team's conceded goals low
xGA: Expected goals conceded - basically xG of opponents vs the team. This will be the overall grade of defensive capabilities.
Att 3rd Tackles %: Percentage of total tackles made that were in the opponent's attacking 3rd. This has a high correlation to a lower xGA (0.8) and gives an idea of whether the team plays a high line.
SoT Against: Amount of shots taken against the team. A higher rank means the team has conceded less SoT.
D) Pressing Metrics:
Thanks to Klopp, Guardiola and Tuchel, the high press has become an integral part of the modern game in the EPL. Not to mention, pressing intensity has a high correlation to lower xGAs.
Presses Out Of Possession: How often does the team press when out of possession? Measures if a team prefers to sit back or press opponents.
SCADA: Pressing intensity and quality. How often can the opponent perform shot-creating actions vs defensive actions? A lower value means the press is more intense and effective - opponents have no time to perform shot-creating actions.
Att 3rd Press %: How many of the presses occur in the opponent's Attacking 3rd? This is a clear measure of the high press. It also has a high correlation to lower xGAs.
All metrics were scored from 1 to 20, with rank 1 being the best score.
--
That's all for now! Till my next analysis, take time to go through your team's performance and compare them with the rest - how do you think they can improve?